Mastering Retirement Journal

What goes up must come down?

S & P 500 vs Growth value graph If you have trouble reading this please call 410-677-4848

The title is a little misleading. In investing, it can be a bit of a misnomer that if the price of an asset increases substantially, it becomes “due” for a drop. That said, it isn’t necessarily the just the “price” of the asset increasing, but the valuation that is important to pay attention to. And when you take a look at valuations, what can be a misnomer, becomes true more often than not. Which brings us to this year. Markets so far in 2022 have had a rough start, and we wanted to take a look at what has been driving market performance so far this year.

To start, we can look at valuations of large-cap U.S. stocks. Below is a chart of the forward Price to Earnings ratios of Large-cap Growth, blend and value stocks.

You’ll notice one of these lines isn’t like the rest. That blue line, is U.S. large-cap growth stocks. Their price to earnings ratios had grown substantially starting immediately following the pandemic. As a primer, the price to earnings ratio of the price of one share of stock divided by how much earnings a company generates per share of stock. We use this as one determinant of how over-valued or under valued segments of the market may be. The P/E of U.S. large-cap stocks grew significantly in the months following the pandemic. Said another way, these stocks became quite expensive. As you can probably tell, well over their historical norms. The price of these companies continued to grow well in excess of the growth in earnings the company was generating. That isn’t healthy. One of the things that can cause valuations to drop or reset, is interest rates. And that is precisely what has happened to start the year. Below you can see the relative performance of these three asset groups.


Using a $10,000 initial portfolio value in 2021, you can see that only U.S. large-cap growth has returned to that level. Basically erasing all of the gains that had been made over the preceding 18 months. However, large-cap blend and value stocks remain positive and have dropped, but with a far less magnitude.

So, what is the story here? If valuations get overly expensive, what goes up may come down much closer to its historical averages. It isn’t necessarily just the “price” of a stock, as long as the underlying earnings support the growth. We analyze this frequently in allocating our clients assets. Many of you may remember the “tech bubble” of 1999-2000. It was a similar story of a wildly over-valued market. If you had bought those expensive stocks at the top of their valuation, it would have taken you nearly 10 years to recover your funds. The price you pay (valuation) matters greatly in your risk and return profile moving forward. What goes up, will likely come down to a more “normal” valuation, eventually.

*Investors cannot directly invest in indices. Past performance does not guarantee future results.

Lifetime Gifting

hand holding watering can watering money tree

Retiree’s have benefited from over a decade of an incredible equity market run since the depths of the financial crisis. By and large, “sustainable” portfolio withdrawal rates from 4-6% have held up without depleting original retirement balances. We frequently see individuals who are in or past their first decade of retirement have significantly more in assets than they started with at retirement, even after spending. To say this is a great result of course is an understatement.

We often get the question, “What should I do with it?” The answer of course depends on your goals. However, we often recommend clients to consider lifetime gifting. A lifetime gift is just that, a gift to your child, grandchild, other relative or charity during your life. While of course these funds can be bequeathed to various beneficiaries at death, watching the impact these funds can have on someone’s life can be quite meaningful to you. Watching those dollars work today can be a real reward.

There are also the financial planning considerations. “Qualified” or retirement monies that are in tax-deferred accounts likely must be depleted by the next generation within a 10-year window. This condenses the time for funds to be distributed and can have a significant tax impact on the recipient. Of course, this could result in more dollars than necessary being paid in taxes. Starting the gifting during your life may mean lower taxes paid by you, and more dollars being kept in your family. For charities, considering a QCD, or qualified charitable distribution is low hanging fruit to get the most bang for your buck. You don’t have to itemize your deductions, and funds are directly distributed from your IRA to the charity of your choice. This will satisfy all or a portion of your RMD if you are over 72. This may even reduce the taxes you pay on your Social Security benefits.

For 2022, you can gift up to $16,000 per person or $32,000 per couple to an individual without incurring any gift tax. Qualified Charitable Distributions are limited to $100,000 and are only allowable for those over age 70.5. Both strategies can make quite a bit of financial planning sense, but also give you the opportunity to watch the impact your dollars can make to those people and causes that matter to you most. You should speak to your financial professional and or tax advisor on the best way to start a gifting plan to those you love or to a charity of your choice.


The views are those of Robert Jeter, CFP®, CRPC and Eric Johnston, CFP® and should not be construed as specific investment advice. Investors cannot directly invest in indices. Past performance is not a guarantee of future results.

Investments in securities do not offer a fixed rate of return. Principal, yield and/or share price will fluctuate with changes in market conditions and, when sold or redeemed, you may receive more or less than originally invested. No system or financial planning strategy can guarantee future results.

You should consult your tax advisor for specific advice on your situation and whether the strategies above may make sense for you.

Investment Advisor Representative offering securities and advisory services offered through Cetera Advisors LLC, member FINRA/SIPC, a broker dealer and a Registered Investment Adviser. Cetera is under separate ownership from any other named entity.

What’s Up With the Consumer?

Graph of personal saving rate If you have trouble reading this please call 410-677-4848

In our most recent investment committee meeting, we were discussing the importance and state of the U.S. consumer. It’s an important topic, and something we often pay attention to. Why? If you break down the components of U.S. economic growth, 70% comes from “consumption”. In plain terms, spending on various goods and services. Our ability to spend, and increase spending is of course largely based on a myriad of individual circumstances. However, when forecasting the business environment and climate, it’s important to see how consumers in aggregate fare today vs. history and what those spending patterns may look like in the near future.

One key metric is consumer debt to income ratios. You can think of this as the percentage of income a household puts towards debt payments. The higher this figure, the more debt consumers have, and the less ability they may have to increase spending moving forward. Looking at the data set from the Federal Reserve Bank of St. Louis, the latest reading from the 3rd quarter of 2021 was 9.21%. Going back to the earliest data we have in the dataset in 1980, that figure was 10.6%. And at the height of the housing boom in 2007, it was as high as 13%. So, on a relative basis, consumers seem to be keeping debt levels, and payments in check.

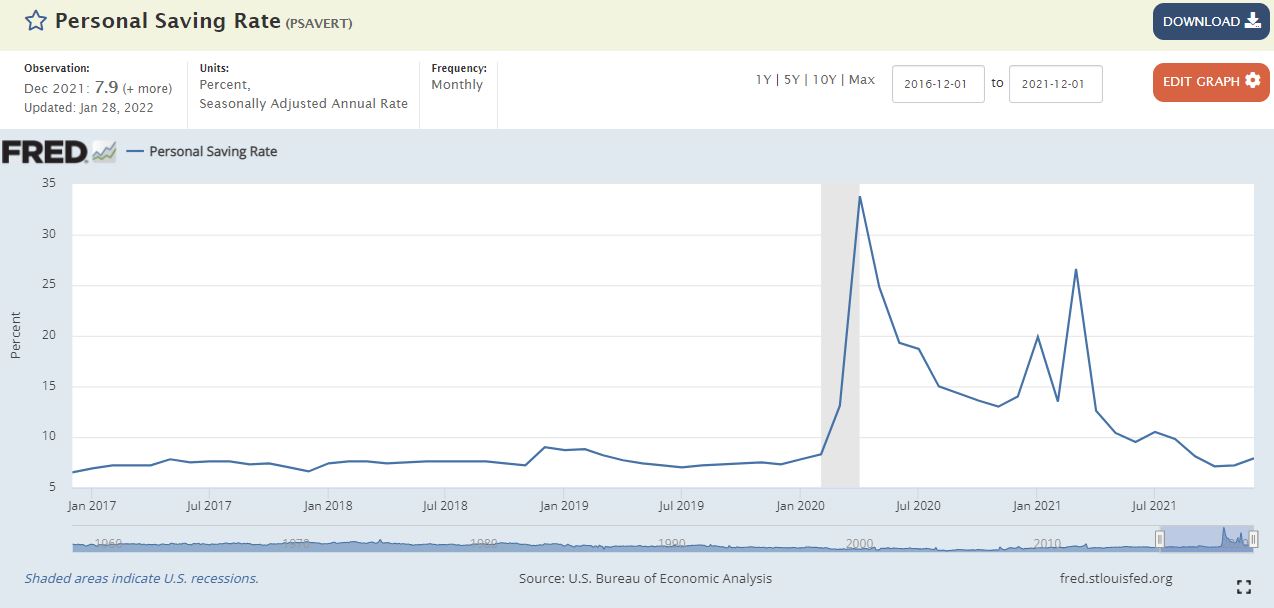
Another item we follow is personal savings rates. Another data point provided by the St. Louis Fed, this measures the amount of disposable income that gets saved. This is usually indicative of a healthy consumer, and when savings rates increase, it generally means that personal financial situations are improving through additional savings being built up. The latest reading in December of 2021 was 7.9%, which is slightly below its long-run average. This is coming down from nearly 20-25% during the earlier days of the pandemic in which there was substantial fiscal stimulus and direct stimulus checks to Americans. This is likely indicative that some of the excess savings built up over the pandemic is being spent and fueling some of the significant consumption at current.

In summary, looking at these datasets as a proxy for the state of the average consumer in the U.S. would leave you feeling optimistic. We’d agree. These numbers support a historically better-off consumer, and that may support further demand for goods and services across the U.S. economy in the near future.


The views are those of Robert Jeter, CFP®, CRPC and Eric Johnston, CFP® and should not be construed as specific investment advice. Investors cannot directly invest in indices. Past performance is not a guarantee of future results.

Investments in securities do not offer a fixed rate of return. Principal, yield and/or share price will fluctuate with changes in market conditions and, when sold or redeemed, you may receive more or less than originally invested. No system or financial planning strategy can guarantee future results.

Additional risks are associated with international investing, such as currency fluctuations, political and economic stability, and differences in accounting standards.

Investment Advisor Representative offering securities and advisory services offered through Cetera Advisors LLC, member FINRA/SIPC, a broker dealer and a Registered Investment Adviser. Cetera is under separate ownership from any other named entity.